Make support activity visible
Show ticket volumes, resolution times, and recurring categories from your reporting data.
Give managed service clients a clear view of their contract and how the service is performing. Bring prepared ticketing, monitoring, and usage data into a dashboard so each account can review its own support trends, recorded availability, and service metrics.
14-day free trial. No credit card required.
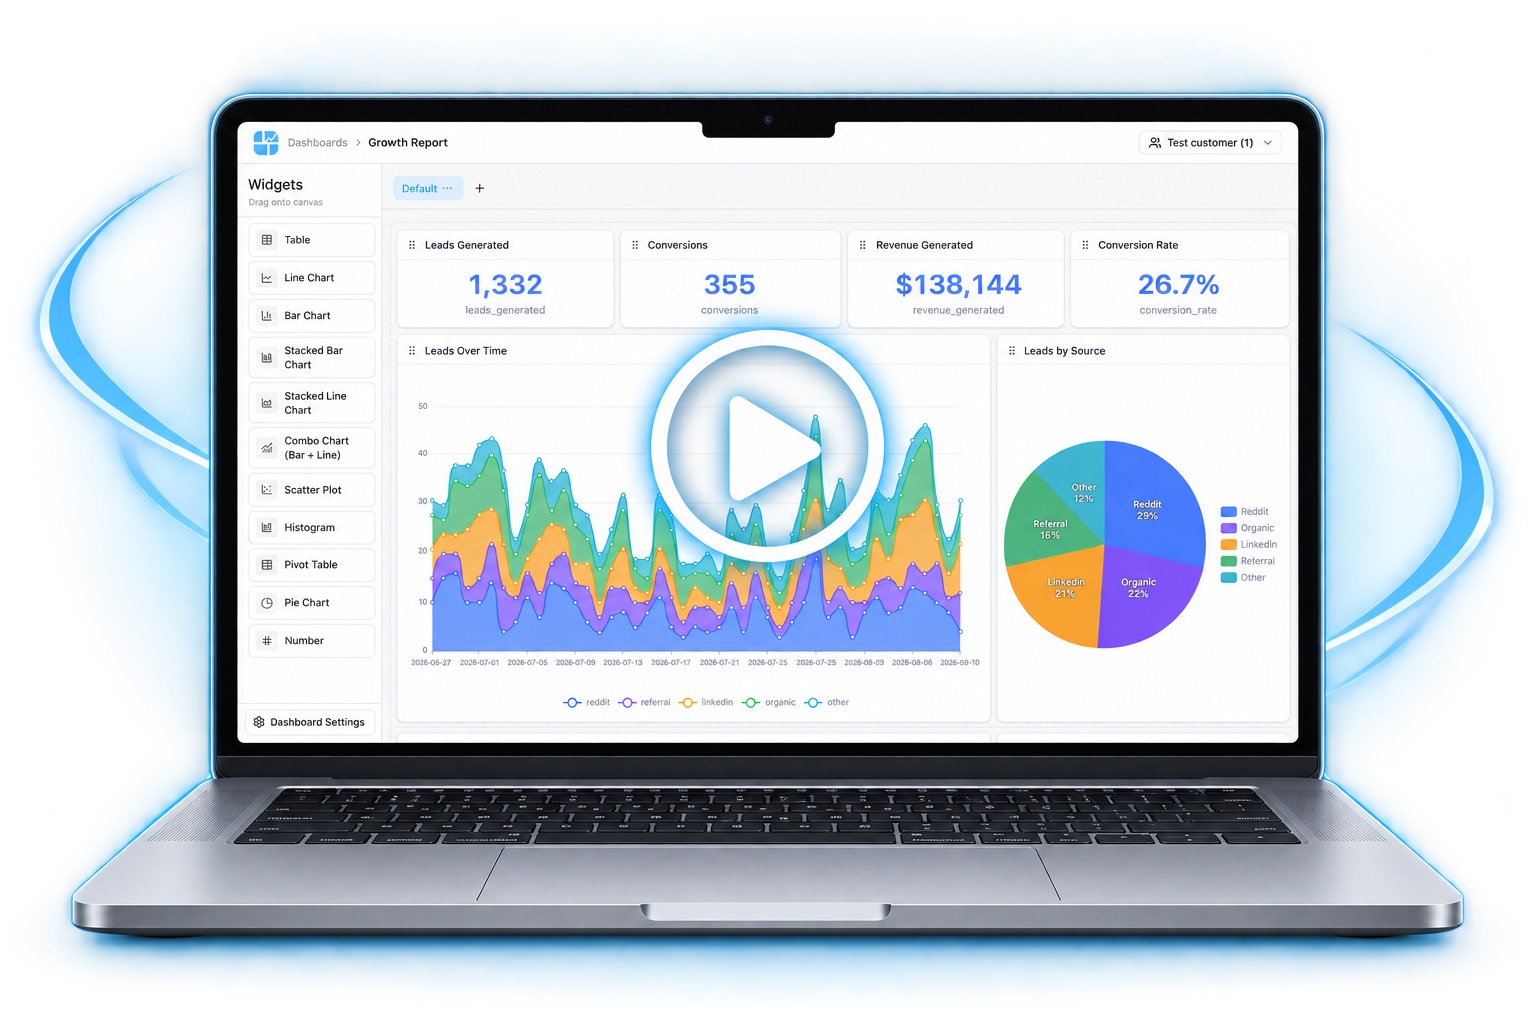
The quarterly review, available before the meeting.
Show ticket volumes, resolution times, and recurring categories from your reporting data.
Present measured uptime and recorded SLA results for a defined period.
Clients see the same contract view before the next service meeting.
Connect the data you already keep, build the report once, and give each account a login.
Tickets, availability, and usage from the exports or database you already maintain.
The same structure for every retainer.
They see their contract's figures only.
Built from the records you connect. These are the reports you can build from the records you connect.
Volume for that client in the period.
The median or other figure your help desk data supports.
Uptime for the reporting window you define.
The service consumption you already meter.
Reports on top of the tools you already runYour help desk and monitoring tools keep collecting and managing the data. CustomerDashboard presents the client report you prepare from that data.
No. Those tools keep collecting and managing operational data. CustomerDashboard presents the reports you prepare for each client.
No. This is the reporting view. Ticket handling stays in your help desk.
Give managed service clients a clear view of their contract and how the service is performing.
14-day free trial. No credit card required.